Your Claude Code Week Is About to Get a Third Shorter
The +50% weekly limit boost is scheduled to lapse August 19. Limits are weather—capacity-driven, changed five times in a year. Tokens-per-task is the only forecast you control.
There’s a date circled on every Claude Code team’s calendar this month, whether they know it or not: August 19. That’s when the +50% weekly usage boost—running as a promotion since May 13 and already extended three times—is scheduled to lapse, as of publication. When it does, the weekly wall arrives roughly a third sooner than the one your team has spent all summer calibrating against. The May 6 doubling of 5-hour limits is permanent—your sessions stay long. It’s the week that shrinks.
Maybe Anthropic extends a fourth time. Maybe not. That uncertainty is precisely the point of this post.
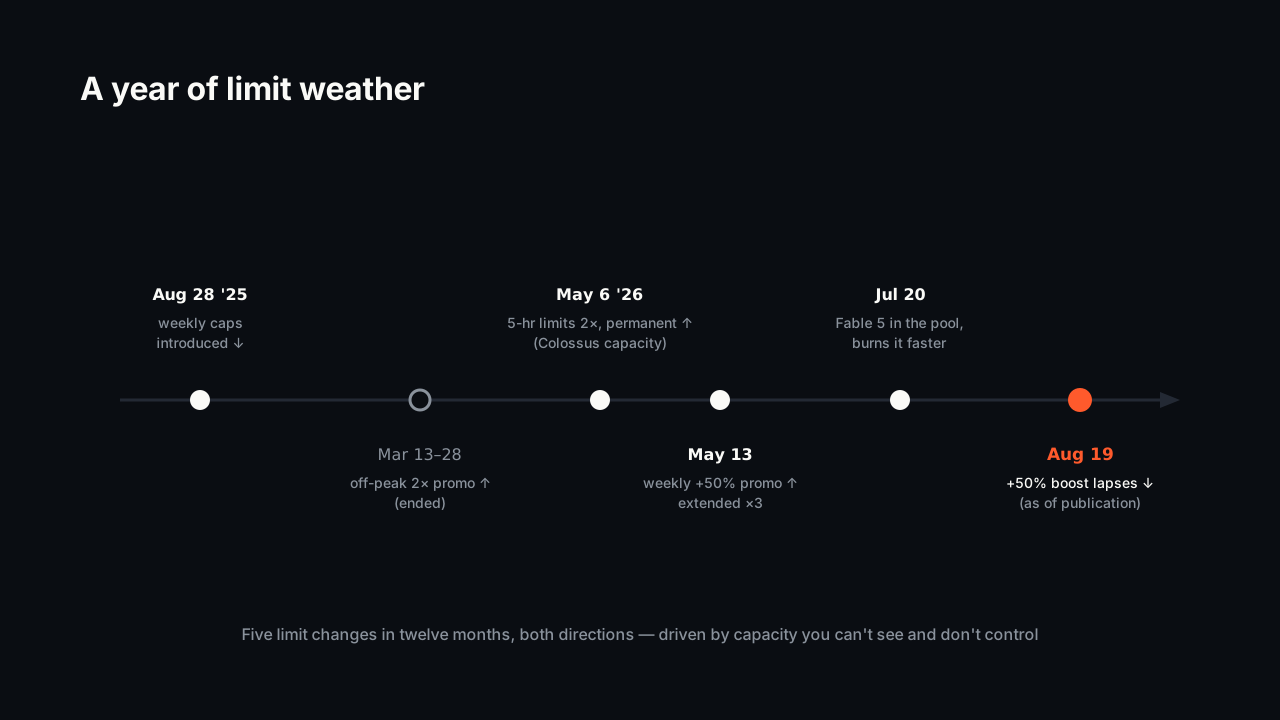
A Year of Limit Weather
Look at the record. August 28, 2025: weekly caps introduced on top of the rolling 5-hour window, aimed at 24/7 automation and account resellers. March 13–28, 2026: a two-week off-peak doubling promo, then gone. May 6, 2026: 5-hour limits permanently doubled and peak-hour throttling removed—riding on 300+ megawatts of new capacity from the Colossus 1 deal. May 13, 2026: weekly limits +50%, “temporarily”—extended in July, extended again, extended a third time, now dated August 19. And since July 20, Fable 5 sits inside the same weekly pool at up to 50% of it, burning limits faster than other models per task.
Five changes in twelve months, and the pattern behind them is no secret: capacity. When new compute comes online, limits loosen. When demand outruns supply, they tighten. Your weekly allowance is downstream of datacenter deals and demand curves you will never see, and it will keep moving—up in good quarters, down in tight ones.
Limits, in other words, are weather. You don’t control the sky. You control how much fuel you burn per mile.
The Official Advice Is Telling
Read any guide to stretching Claude Code limits—including guidance echoing Anthropic’s own—and the list is always the same: run /clear between tasks, /compact mid-task, keep CLAUDE.md short, default to Sonnet, and—the big one—“point Claude to file paths instead of pasting entire files.”
Every item on that list is context hygiene. The entire official playbook for surviving limit weather is feed the model less. Which raises the obvious question: if the highest-leverage lever is loading less context, why is it a manual checklist instead of infrastructure?
The waste the checklist is chasing is measurable. Your agent finds code by keyword search or vector similarity—recall-optimized instruments that return everything tangentially related. In code, what matters is the dependency edge: OrderService.place_order() calls a repository, which uses a cache policy. Four files form the chain. The keyword firehose returns twenty. (Full primer here.)
Coograph ships a committed benchmark—a single fixed task (“Add caching to OrderService.place_order()”) against a single committed fixture (bench/fixtures/sample-app/), both in the repo, rerunnable by anyone. On that task:
- Naive grep + read all matches: 20 files, ~4,764 input tokens, 21 tool calls.
- Graph minimal-context query: 4 files, ~969 input tokens, 5 tool calls.
~80% of the input tokens were weather exposure—burn that bought nothing, on one representative task.
The Rollback Math
Put the two numbers together. The rollback shrinks the weekly pot from 150% to 100% of baseline—the wall arrives a third sooner. The graph shrinks the per-task burn ~4.9× (4,764 ÷ 969—illustrative, input tokens only).
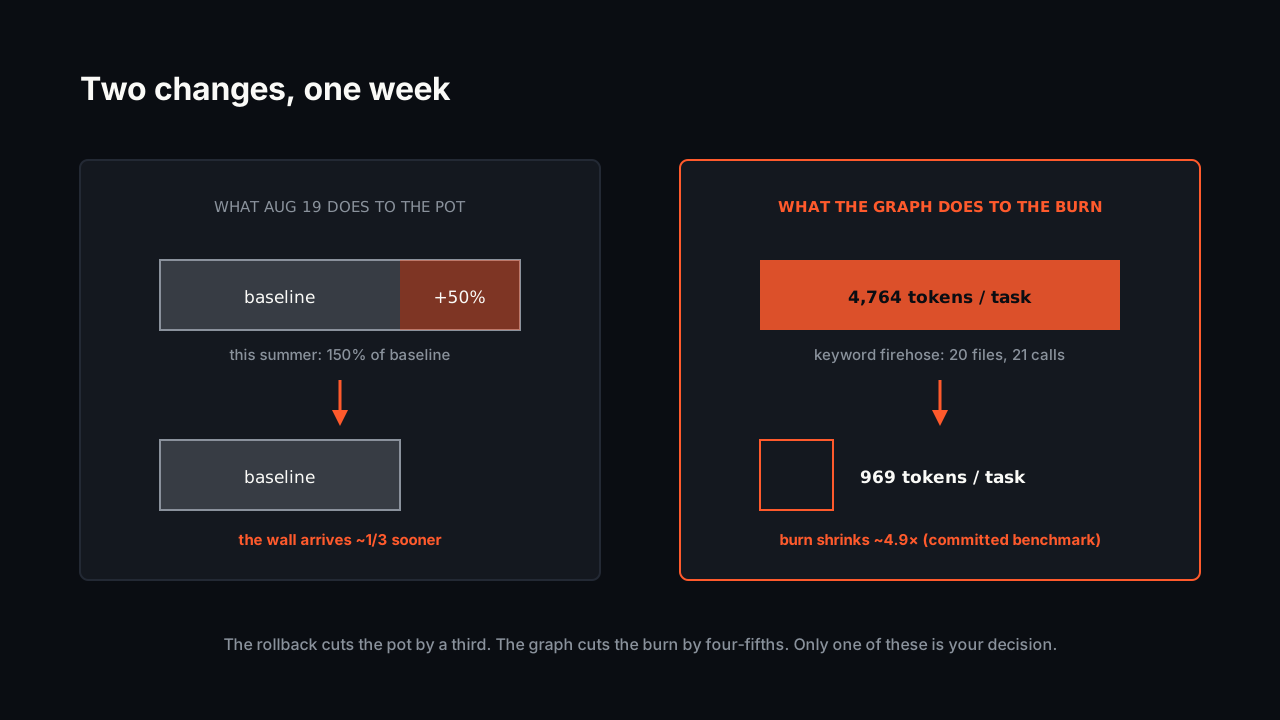
Now count tasks per week, baseline = a naive agent on the post-rollback limit:
- Naive agent, boosted limit (today): ~1.5× baseline tasks.
- Naive agent, after August 19: 1× — the third your team loses.
- Graph context, after August 19: ~4.9× — more than triple what the naive setup gets with the boost.
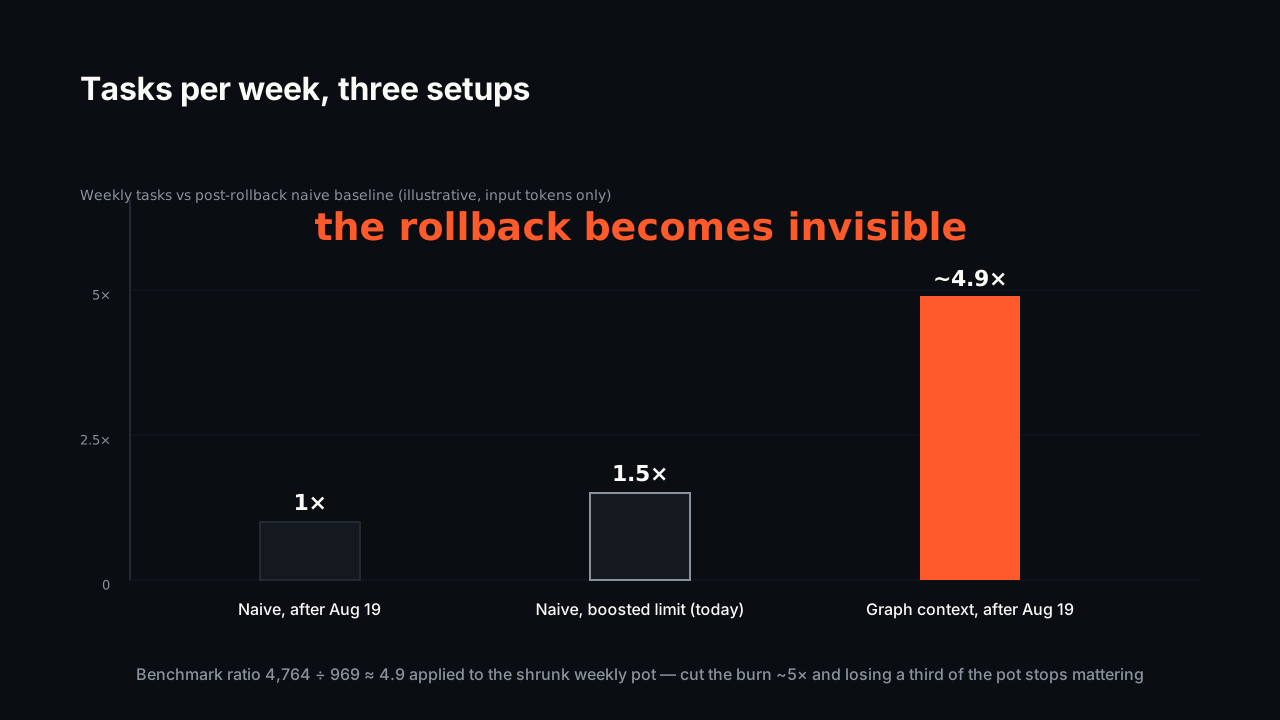
Cut context per task ~5× and August 19 becomes invisible. Not softened—invisible, with headroom. The team that fixed its burn rate doesn’t refresh the usage dashboard on Wednesday, doesn’t care whether the boost gets a fourth extension, and doesn’t renegotiate its workflow every time the weather shifts. The illustrative math is input-only; your repo and task mix set the real number. But the direction survives any discount you apply to it.
And because the weekly pool is shared across every model—with Fable 5 capped at half of it and burning faster per task—the same reduction stretches your Fable slice, your Sonnet bulk work, and whatever the pool holds next quarter. This is the fifth meter shape we’ve written about since June: quota, dollars, caps, inclusion, now rollback. The meter keeps changing. The lever doesn’t.
Automate the Checklist
Coograph is an open-source, MIT-licensed parser and graph engine. It parses your codebase with tree-sitter (Python, TypeScript, JavaScript, Go, Rust, Java, C#, Ruby, and more, with a regex fallback) into one local SQLite file—.code-graph/graph.db—that never leaves your machine. Your agent queries it through MCP tools (get_minimal_context, query_graph) instead of grepping, and gets the dependency chain—the 4 files, not the 20—in one pass. A git hook re-parses only changed files per commit.
Setup is minutes: clone Coograph as a sibling directory, run /coograph-init from Claude Code (or Copilot, Cursor, Windsurf, Codex CLI, OpenCode, Aider, Cline), and build the graph. It’s the “point to file paths, not whole files” advice, made structural: the agent doesn’t need the discipline, because the graph hands it the right paths.
What exactly changes on August 19?
As of publication, the +50% weekly usage boost (a promotion since May 13, extended three times) is scheduled to lapse. Weekly limits return to baseline—the weekly wall arrives roughly a third sooner. The May 6 permanent doubling of 5-hour session limits is unaffected. Anthropic may extend again; the schedule said that three extensions ago, too.
Will Anthropic just extend it again?
Possibly—it’s happened three times. But the record shows limits moving five times in twelve months, in both directions, driven by capacity. Planning your team’s throughput around the next extension is planning around weather. Cutting tokens-per-task works in every forecast.
How much does the graph actually offset?
On the committed benchmark, dependency-graph context cut input tokens ~80% (4,764 → 969, ≈4.9×) and tool calls ~4× (21 → 5). Applied to the rollback, illustratively and input-only: a naive agent on the boosted limit completes ~1.5× baseline tasks; a graph-context agent on the post-rollback limit completes ~4.9×—more than 3× the boosted naive setup. Your repo and task mix set the real number.
Doesn’t /clear and /compact already solve this?
They help—use them. But they trim conversation state, not retrieval waste: the agent still reads 20 files to change 4 before there’s anything to compact. The graph cuts what gets loaded in the first place. The two compose.
Open source or paid?
The whole repo is MIT-licensed and free forever—no gated features. Coograph Pro is bespoke services (integration, custom parsers, benchmarking against your workload), not a locked tier.
August 19 will either take a third of your week or it won’t—and next quarter’s weather will move the wall again, one direction or the other. The teams that stopped caring are the ones that fixed the burn rate. Generate your first graph with the getting-started guide, see what’s inside it on the code-graph page, or talk to us about Coograph Pro if you want your allowance instrumented before the forecast changes. The benchmark is committed. Rerun it before the 19th.
Cut your AI coding bill 67–78%. Coograph is MIT-licensed and free forever. Pro is bespoke services.