We Reran Our Benchmark With a Real Tokenizer. The Number Went Down. We're Publishing It.
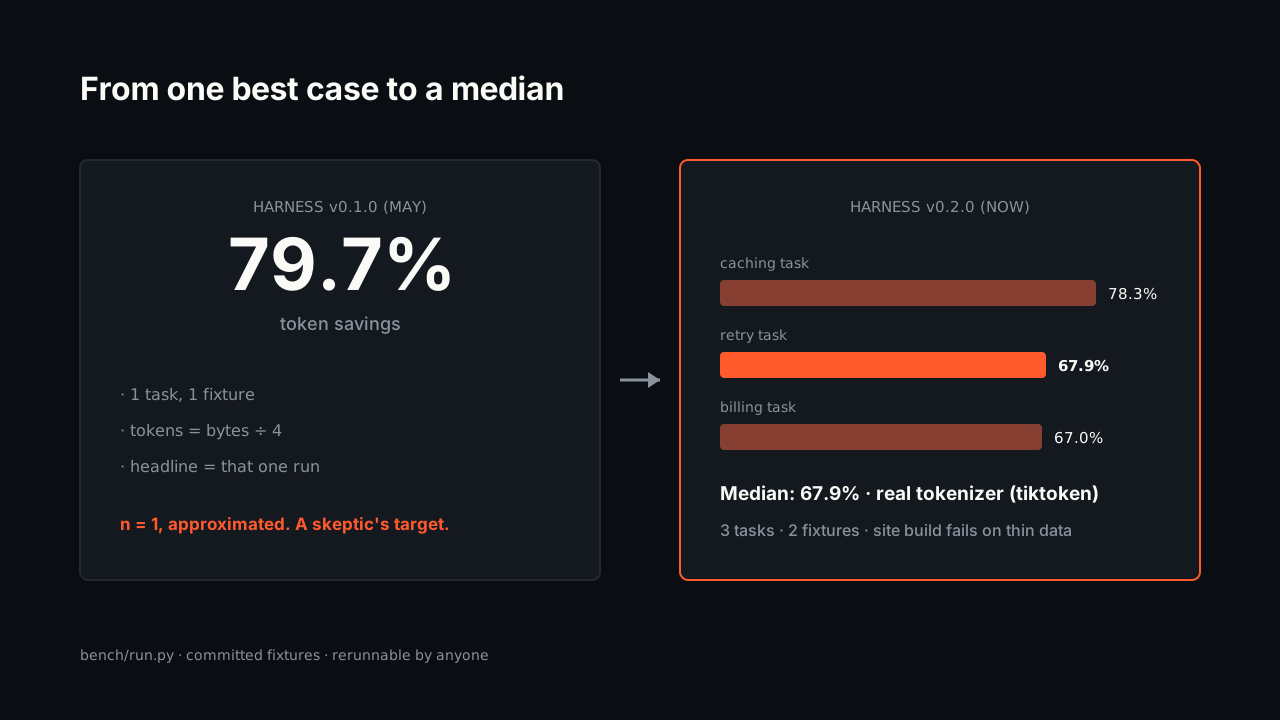
Our headline claim was 79.7% token savings — one task, one fixture, bytes ÷ 4. The new harness runs 3 tasks with tiktoken and reports the median: 67.9%. Here's why the lower number is worth more, and what shipped with it.
Until this morning, the Coograph landing page said ~80% fewer tokens. That number was real — but it came from one task, on one fixture, with tokens approximated as bytes ÷ 4. A single committed best case, honestly labeled, still a single best case.
As of today the page says 67.9%. Nothing got worse. The measurement got better.
Why We Lowered Our Own Headline
The AI dev-tools market has a benchmark problem. Vendor-run numbers are everywhere; independently verifiable ones are rare. The tools winning trust in 2026 are the ones whose claims survive a skeptical rerun — grepai’s adoption ran on an independently verified benchmark, while “70%+ quality gains” style claims from vendors get discounted on contact. We sell token efficiency to people who are professionally suspicious of token-efficiency claims. The only durable move is to make the claim smaller and the evidence bigger.
So harness v0.2.0 changes three things:
- Three tasks, two fixtures, instead of one and one. A Python caching task, a Python billing task, and a TypeScript/React retry task — each a realistic edit with a realistic spread of false positives (tests, docs, wire types, downstream callers that mention the keyword but don’t matter).
- Real token counts. When
tiktokenis available the harness counts actual tokens (tiktoken/cl100k_base) instead of bytes ÷ 4. The method used is recorded in every result file. - The headline is the median, not the best case. Per-task: 78.3%, 67.9%, 67.0% fewer input tokens; 4.2×, 2.75×, 1.67× fewer tool calls. Site headline: 67.9% and 2.75× — the middle of the distribution, not its flattering end.
Two guard rails came with it. A task whose naive grep hits fewer than 2× its minimal-context file count is rejected by the harness — you cannot construct a fixture without false positives and harvest an inflated number from it. And the site build now fails if the results file is missing, has fewer than 3 tasks, or references fixture files that are no longer committed. The marketing literally cannot ship without the evidence.
What ~68% Still Means for Your Bill
The story the number tells is unchanged, just better-founded: your agent’s retrieval layer, not your prompt discipline, is where most of the burn lives. Keyword search returns everything that mentions a symbol; the change you’re making touches the few files on its dependency path. Across our three tasks the naive flow read 5–21 files per task where 2–4 were needed. Multiply by every task, every day, every seat — under weekly limits, metered Fable 5, or spend caps — and the median is the honest floor of what structural retrieval recovers.
The Graph Now Budgets Itself
The same release ships the feature the benchmark argues for. get_review_context — the MCP tool that hands your agent the file set for a review — now returns a ranked, token-priced list instead of an unordered one, and accepts a budget:
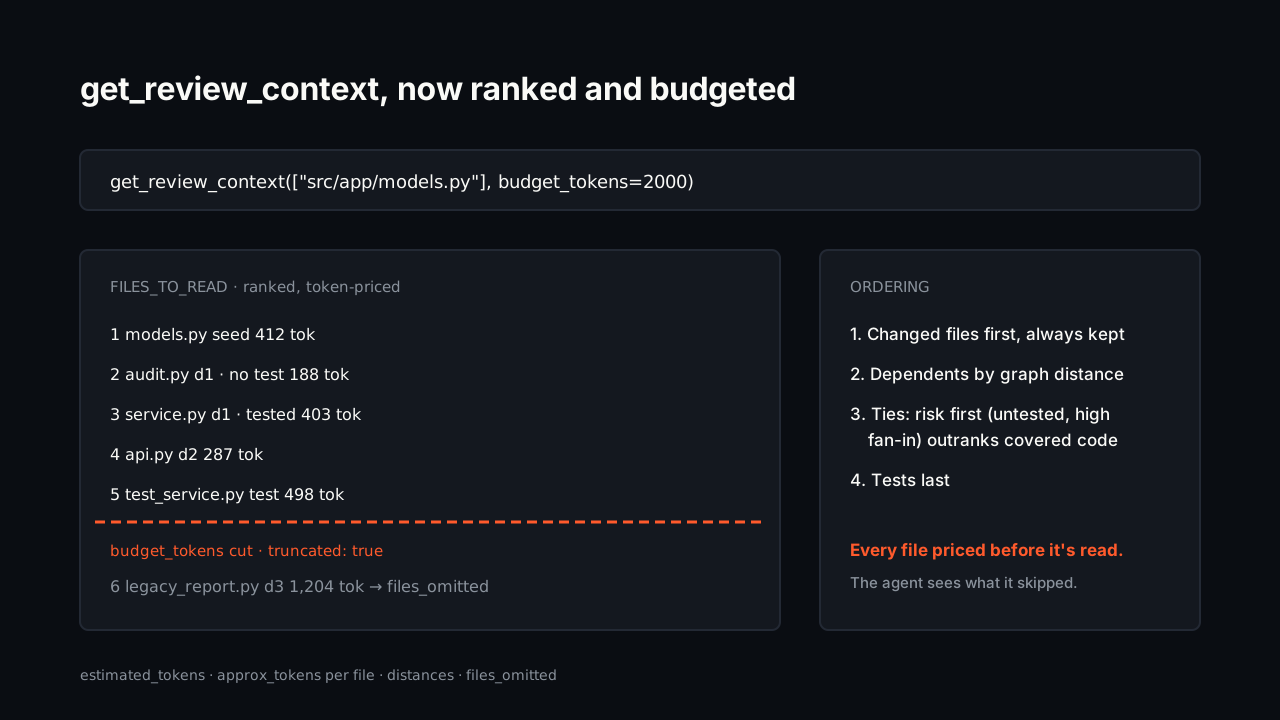
Changed files come first and are never cut. Dependents follow by graph distance — direct importers before transitive ones — with risk breaking ties: an untested, high-fan-in file outranks a covered one. Tests close the list. Every entry carries an approx_tokens estimate, and budget_tokens truncates the tail while telling the agent exactly what was omitted, so “read more” is an explicit, priced decision instead of a default. This is the curated-retrieval pattern the 2026 cost literature keeps converging on — context selection as infrastructure, not agent discipline.
And a Test Rig That Keeps Us Honest at the Tool Level
Benchmarks check the claim; they don’t check the product. So the third piece is coograph-testbed: four small-but-real projects — Python, TypeScript/React (with tsconfig path aliases), Go, and Java — that a runner initializes from scratch the way a real install does, builds the graph, and then asserts actual MCP tool behavior: dependency edges per stack, BFS distances, ranking order, every budget-truncation case, incremental re-index after an edit.
It paid for itself before it was an hour old: writing the assertions exposed that query_graph("importers_of") had never returned a result — it matched raw import strings against a file ID, a bug no demo ever surfaced. Fixed, asserted, and now every future code-graph change is gated on 4/4 stacks passing.
Did the product get worse? The number dropped 12 points.
The product is unchanged on the original task — 78.3% with a real tokenizer, versus 79.7% approximated. The headline dropped because it now reports the median of three tasks instead of one favorable case. Same graph, harder grading.
Why the median and not the mean or the best task?
The median is robust to a single flattering (or unflattering) outlier, and it’s the number a skeptical reader would compute anyway. Per-task detail ships in every result file — nothing is hidden, the featured task is still shown, it just doesn’t get to be the headline.
Is 3 tasks enough?
No — it’s the honest minimum, and the build refuses to ship with fewer. The harness now scales by adding manifest entries, and the non-triviality guard keeps new tasks from being softballs. More tasks and fixtures land over time; the median will move as they do, in whatever direction it moves.
Can I verify any of this?
Yes — that’s the point. Fixtures, manifests, and the harness are committed; python bench/run.py reproduces every number on the same git sha, and each result records its fixture hashes and token method. The testbed repo is public too. If your rerun disagrees with our headline, open an issue — that’s a bug in our claim.
Open source or paid?
All of it — harness, fixtures, testbed, and the budgeted review context — is MIT-licensed and free. Coograph Pro is bespoke services, including running this same benchmark methodology against your actual repos and task mix.
A benchmark you can’t rerun is an ad. Ours got smaller and harder to argue with on the same day the product got a budget flag. Rerun it yourself from the getting-started guide, read the methodology in bench/README.md, or talk to us about measuring your own repos the same way. The lower number is the one we’d want shown to us.
Cut your AI coding bill 67–78%. Coograph is MIT-licensed and free forever. Pro is bespoke services.